

Where is BTC heading?

Today I will focus on Bitcoin and where its price is most likely heading in the coming months, as always with a touch of macro overview.
Are We There Yet?
Bulls can’t wait for the uptrend to properly kick in, but are there actual signs of a bull cycle coming up from macro?
Everyone knows inflation has been coming down and the US Stock market is buzzing in general (although only a handful of stocks pulling the rest up in SP500 like NVDA), VIX is scraping bottom, etc.
Despite all that FED and their head Jerome Powell are not that optimistic and not giving in to risk on market pressure that is expecting interest rate cuts. In fact, there is still one more hike likely coming this year, though no one knows when as JP has been as vague as always in making any forward guidance over the last probably 18 months.
Banking sector has been in trouble for a while now and it does not seem like it is out of the woods, Evergrande announced bankruptcy which have rattled the markets a little bit, but probably not as much as anyone wanting lower prices would hope.
I will show one chart below, that I think gives a good indication we are definitely not there yet and should expect more pain to come (remember that for FED to cut rates something “bad” needs to happen and risk on markets will fall badly then, not pump like some think).

I think the above does not need much explanation. It clearly shows a housing crisis in US, where the costs to buy a house have skyrocketed, partially due to rising house prices but also due to quickly rising mortgage costs. The last time cost of buying vs renting was so disjointed, 2008 happened and we know how long it took to get out of that hole.
Something has to give, so hang tight this Bear is not giving up yet.

Where are Crypto Prices Heading?
Before we dive into technical analysis, I recommend reading my latest Quicktake on CryptoQuant about using Bitcoin’s Supply in Profit (%) as your healthy on-chain indicator for best buying and selling opportunities. (you will need a free account to read it but it’s worth it as there are tons of metrics I often refer to in my newsletters/posts that will save you from missing good entry/exit points for your crypto, especially BTC investments)
As I was writing this newsletter over few days, news broke out of Grayscale getting closer to spot BTC ETF after a court ruled in their favor. As you will see in charts below, that mini hype did not last long, but can give you a fair idea where price will go if/when that or any other ETF gets SEC’s approval.
Important to know is that a lot of the price move up was driven by derivatives and many surely fell for that mini pump and dump. SEC does not have approve any of the ETFs anytime soon as you can see in below table.

There is some expectation that SEC might comment on some of these by the end of this week, so watch crypto space closely.
Bitcoin
I will focus on weekly timeframe charts only today as these eliminate most of the noise and can give a good idea where price is most likely to go in next few months.
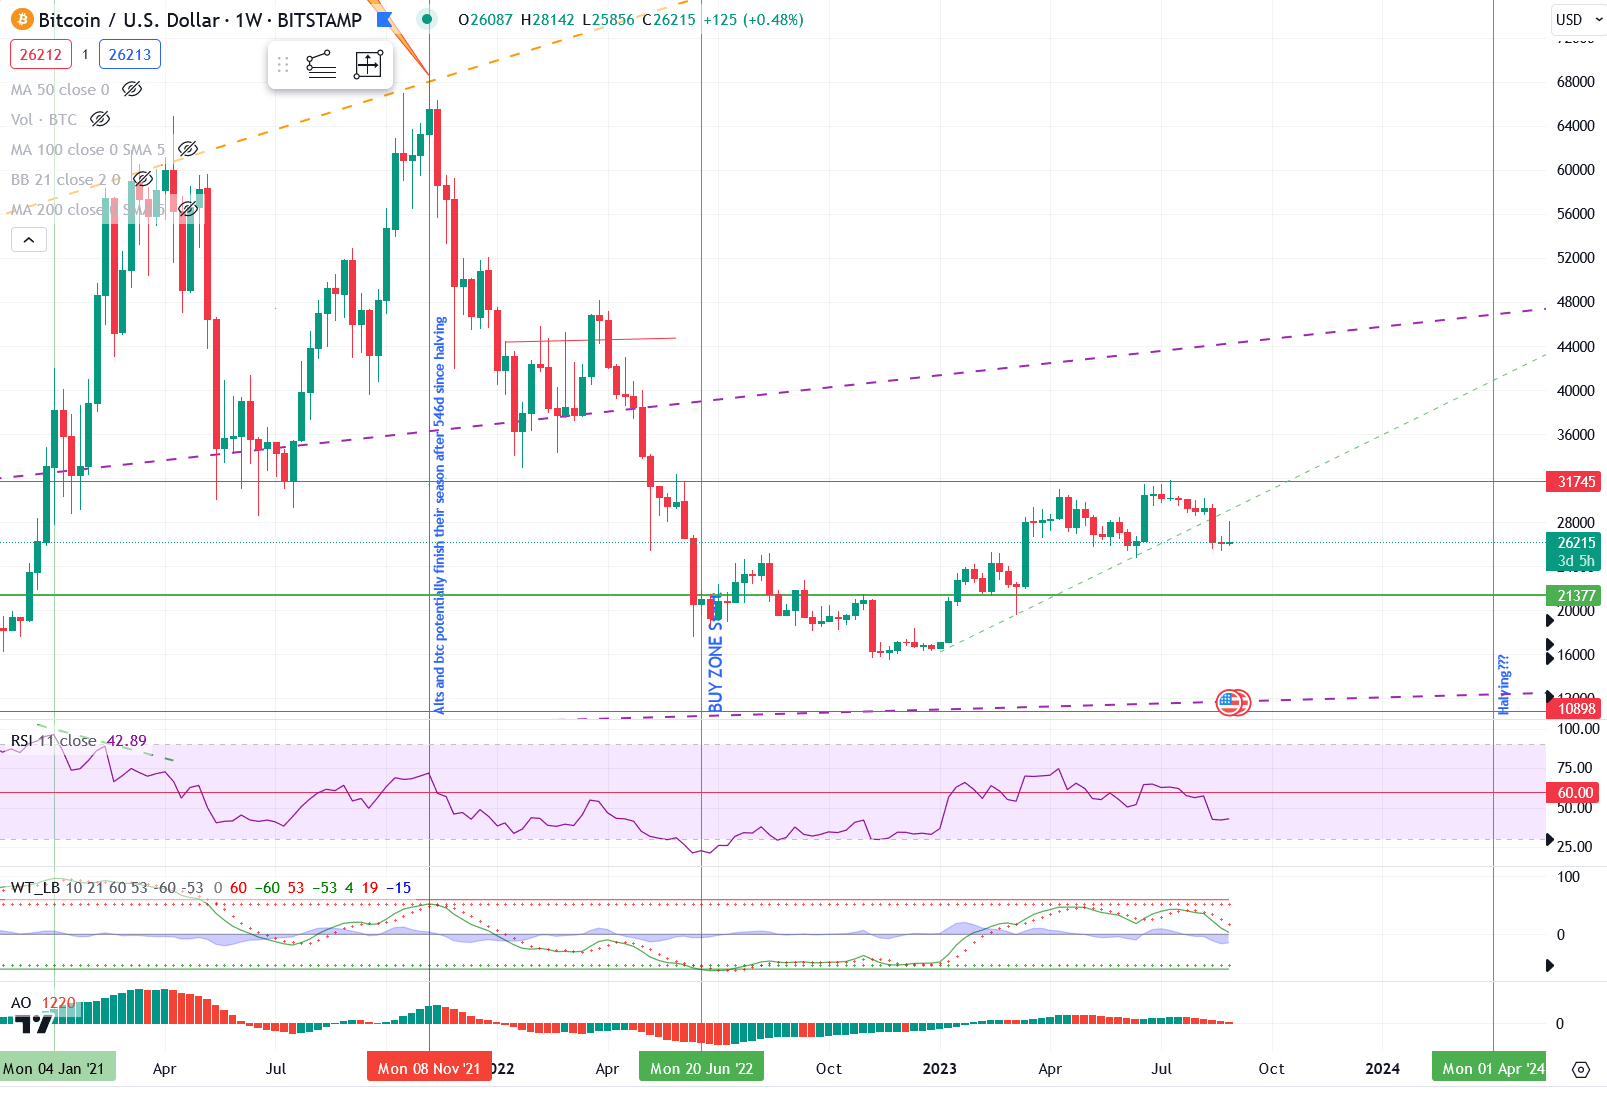
Mini uptrend we have seen since January, looks to have ended with a clear bearish divergence in mid July (see price making new high but the oscillators below the chart did not hit new peaks). There are a good 5-8 weeks at least for this current move down to unfold (we might see a strong push up if indeed a spot ETF gets approved) most likely settling around 21k. I would not rule out lower prices, but that largely depends on macro situation.
Another thing that aligns with my view that we are likely in the last phase of low enough Bitcoin prices is the fact that halving event is around 7-8 months away and looking at past cycles 3-4 months before it, would be best to accumulate assuming we have already gone away from 2022 lows for good.
Bitcoin dominance still holding around 50% and I think we will see it go up again this year, but as mentioned before this should give you a clue it is not time to buy altcoins yet which I will show on other charts below.
Ethereum and altcoins
ETH chart while looking bit better than Bitcoin’s also suggests move to lower price range is more likely than breaking highs from April. Most likely range is 1300-1400, but would not rule out dipping closer to 1100.
I was showing you total mcap chart for altcoins in last newsletter in July and while market bounced from a trend line it did not break previous support making a lower high.
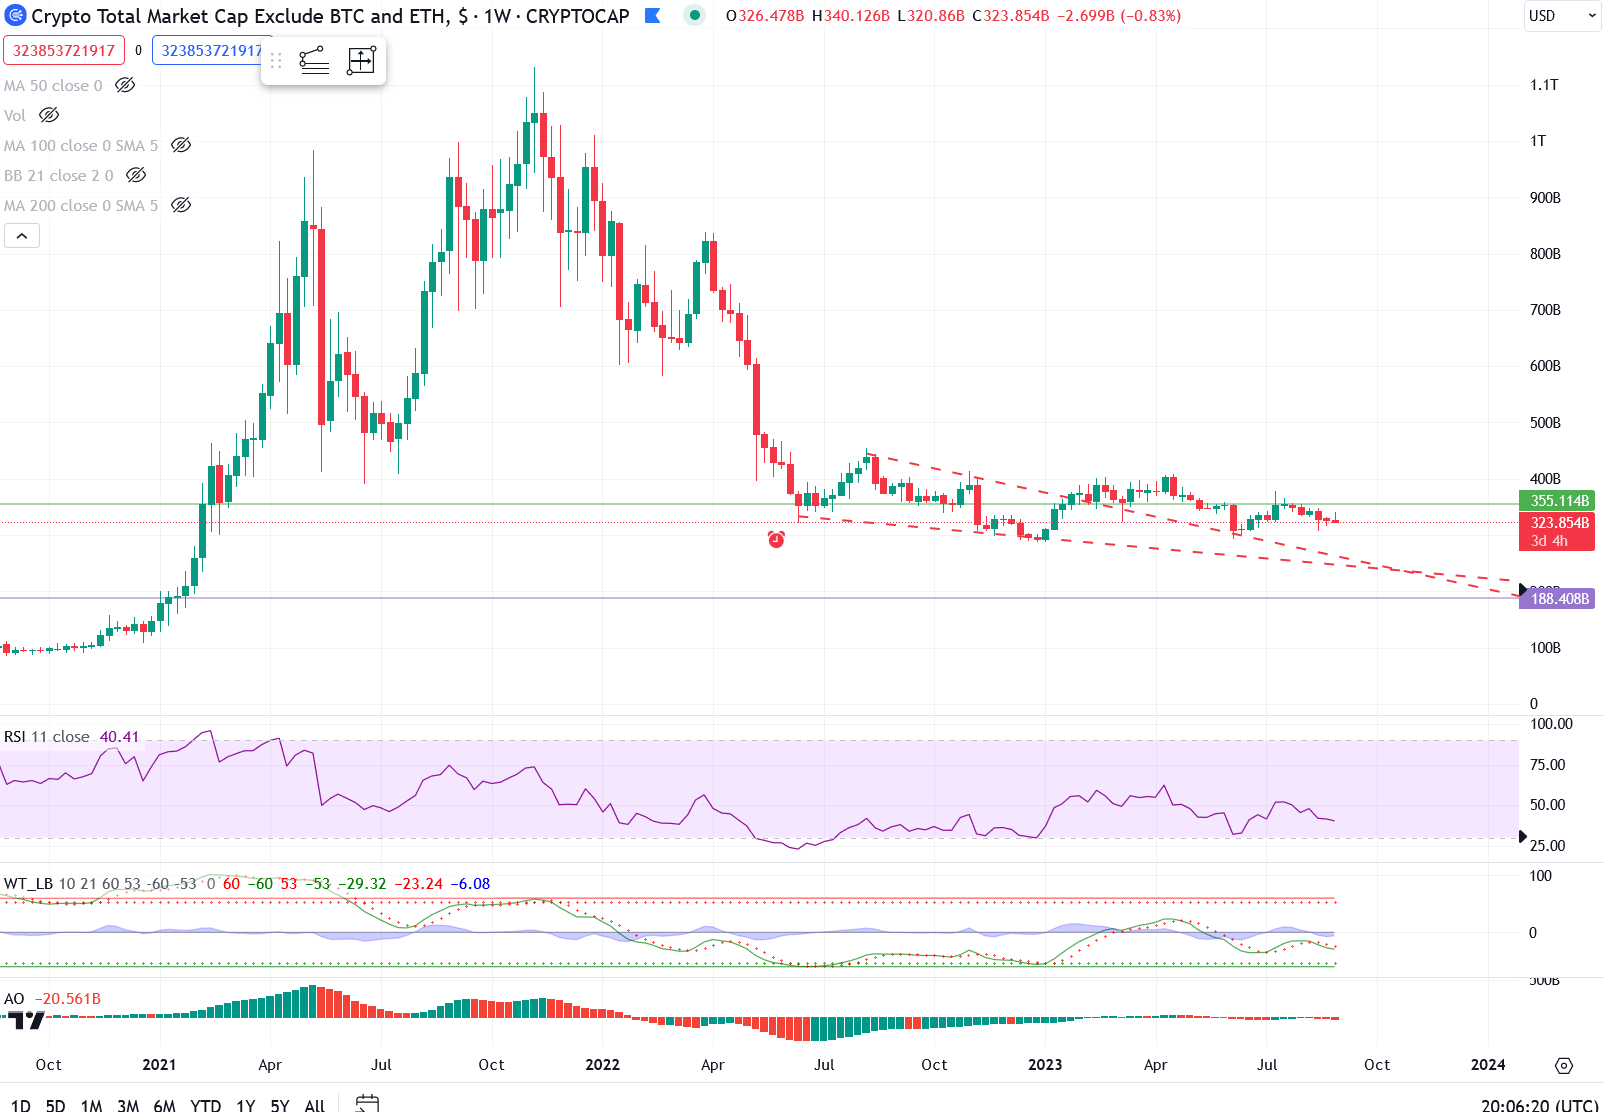
I’ve been always of the opinion that there is no rush in buying altcoins during bear market, even if it might mean you will not get your favorite meme coin dirt cheap, you are saving yourself from grief of finding out one morning your “cheap” coin is 50%+ down. I expect this slower decline in total market cap to continue toward new lows around 250b.
In case you wonder, YES, we are still in BEAR market and will be at least till mid next year.
For now, enjoy low-ish prices keep stacking and learn about new developments in and around crypto space.