

WEEK #3 - 2023
WEEK #3 - 2023
IS BITCOIN BOTTOM IN - PART II ¦ TA and ON-CHAIN ANALYSIS

What a start to 2023. While the stock market hit moderate gains, crypto was on fire, including “lazy” Bitcoin, which finally took back some of the market dominance from altcoins. It definitely exceeded my expectations of a post-CPI data release pump, while expected to see 20.5k and BTC dominance moving away from 40%, the speed at which it got there was impressive.

With the bullish macro narrative in charge, of inflation battle won, soft landing for FED and expectation of rate cuts (despite rate cuts always meaning equities crashing, but I guess bulls plan to worry about it when the time comes), I have some doubts whether reason can contain this pressure to go up for risk-on assets.
Since early November some of the indicators I monitor both on charts and on-chain were showing signs of potential bottom forming. Today I will go over these and hopefully help you decide where we could be in the cycle.
If you followed me for a while you know the good time to buy was when we were under 20k and best when under 16.7k, so those that kept adding to their BTC stack are probably in the best position right now. Not worried whether we go up or down as they have some skin in the game already. Read on though to see what might lie ahead.
Technical Analysis
I would like to start with my less usual TA setup, using Ashi chart and auto generated consolidation “boxes” and key levels. There are less options in MT4 platform I am using for those charts, so excuse me the different look as MT4 lacks TradingView’s flexibility in presenting data.
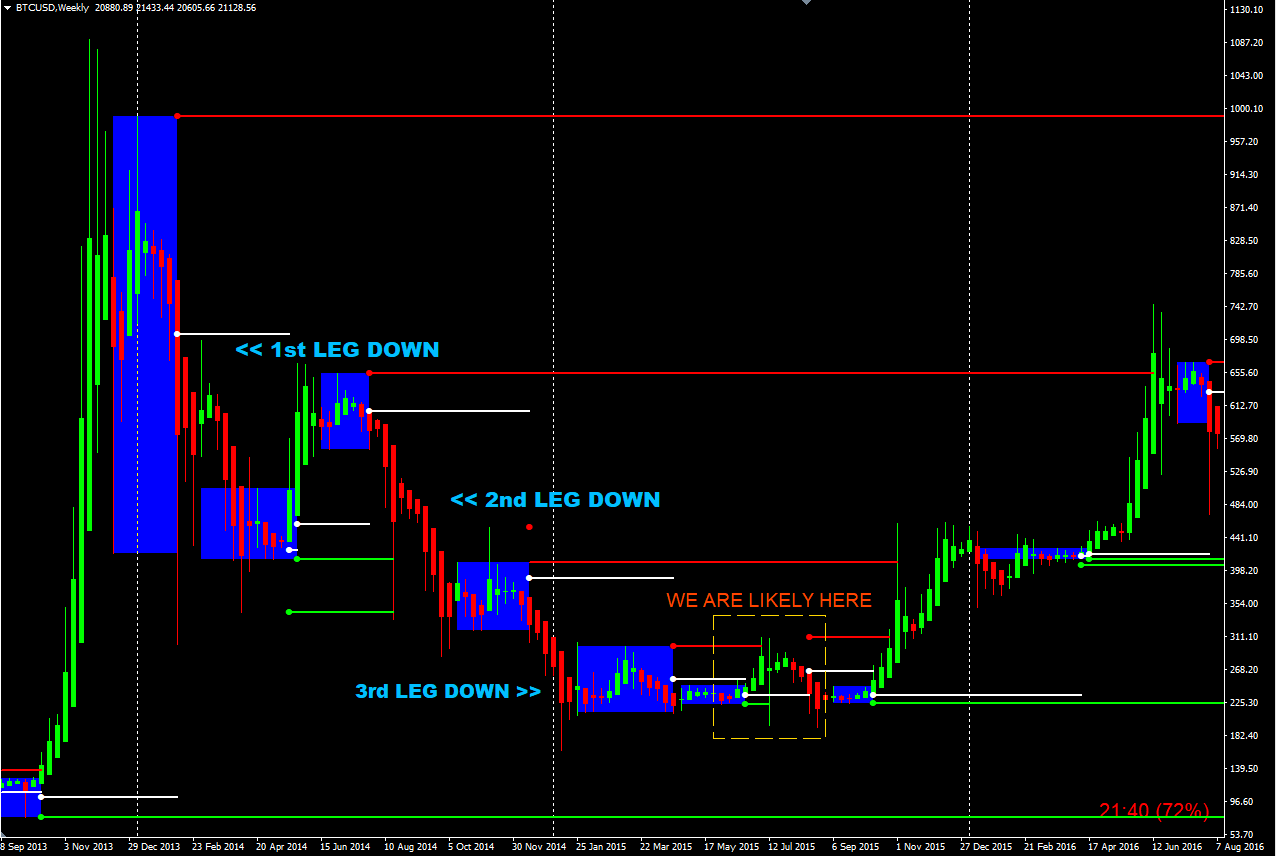
Looking at the above Bear market cycle from 2014/2015, you can clearly see 3 waves of price movement down, ending in an extended period of medium to flat price action before Bitcoin properly escaped the bottom range reaching the top of 2nd leg down.
I have highlighted an area that I believe we could be in right now. The first wave up only reached the top of 3rd leg down (the lowest red resistance level, note how we had 4 of these in both the current and 2014/2015 cycles), then revisited the lows before the next move up reached the top of 2nd leg down consolidation box.
If you look below at the current cycle’s chart, you can see all the key characteristics from 2015 chart:
3 legs down
4 key resistance levels (red lines)
1st breakout to the upside creating a support green line at the bottom of the bear cycle

While we can’t just simply expect history to repeat itself, it is very very close, so I can’t ignore this considering once the 1st breakout to the upside forms on the weekly Bitcoin chart we’ve never had another leg lower.
Taking all the above into account plus some uncertainty in macro for the remainder of 2023, I think we will only see BTC hitting first red level of 22,750$ in the next 2-3 weeks, before it could come back down to around 16,000$.
Please note that 2nd red level is at 25,000$, so very close to 200WMA, which is sure to stall any march up eventually. 3rd red level, so the one after the “1st leg down” from 2022 is at 48,000$ and is my max price Bitcoin could reach this year if we get more of a 2018 hype than 2015 ranging price action.
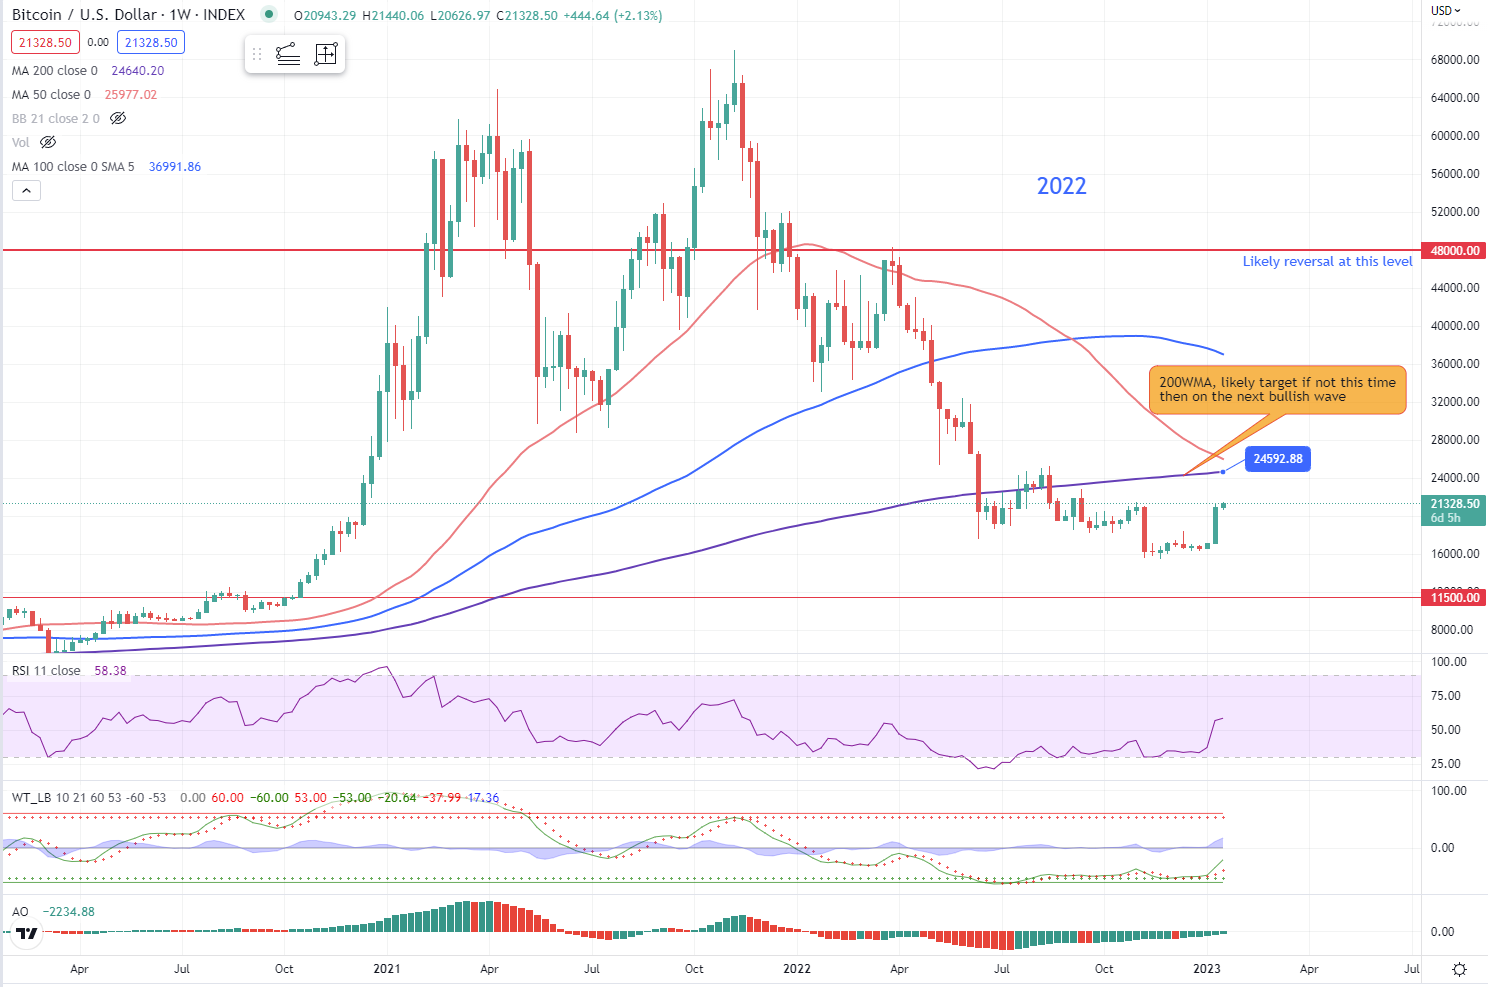
On the regular chart, you can see the current 200WMA price level, as well as 48k which if reached too fast would serve as a very strong level for bears to have a push back to the low 30s.
An interesting thing to note here is the almost imminent weekly “death cross” (50WMA, the red line, crossing below 200WMA, purple line) that has never happened on Bitcoin’s chart. If price is close to 25k when it happens (roughly early Feb) the expectation would be for a downside movement. On the other hand if “death cross” happens with price being already way below where the cross happens, it serves as a contrarian signal and bullish price action is to be expected.
Most of the longer-term predictions here heavily depend on what happens in both macro and crypto. Considering a lot of FTX, Alameda, DCG, Genesis, Nexo, etc. fallout might not have been seen yet, also FED and Jerome Powell could hit this rally in the stock market off its feet in Feb FOMC meeting.
On-chain Analysis
Now let’s have a look if on-chain data confirms TA outlook. I will skip BTC’s Supply in Profit % as I have covered this in CryptoQuant Quicktake yesterday, so if you would like to read it please click the button below.
BITCOIN REALIZED PRICE
Every single bear market, Bitcoin moves below this price for a prolonged period of time. This time was no different and we have dipped in and out a few times, which again resembles more 2015 than 2019 price action. While this is not a definitive measure we won’t see Bitcoin going below 19.7k it certainly can’t be ignored we won’t see lower prices than 15.5k from Nov 2022.

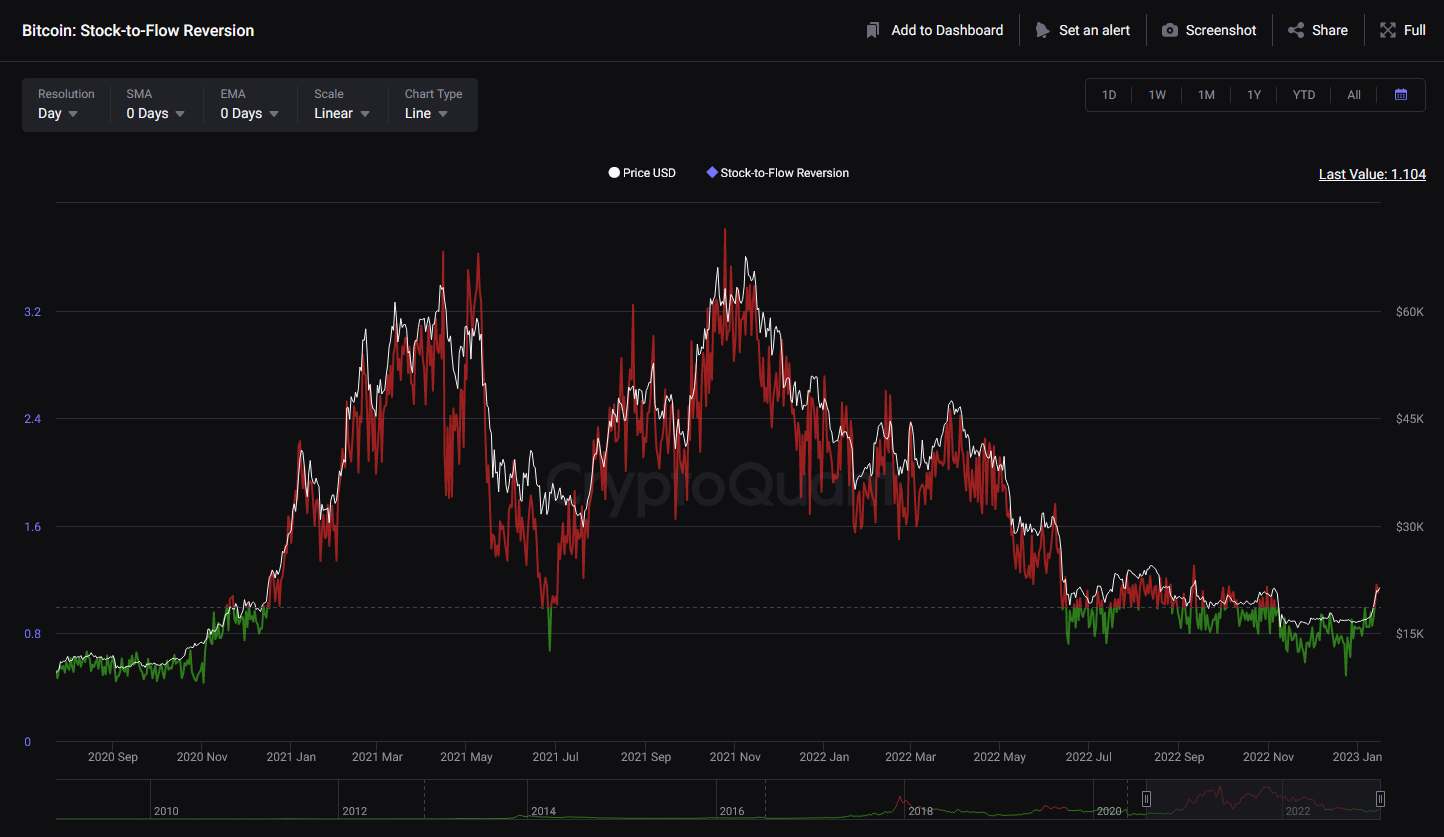
STOCK TO FLOW RATIO - REVERSION
You have seen this chart before and it’s main goal is to show you quickly when price is below stock to flow ratio and similarly to Realized price, when BTC is undervalued. Each cycle Bitcoin is going further and further away from it, so while this latest green streak was shorter than in 2018, if we continue to see red on this chart it will be clear the bottom of the cycle is in.
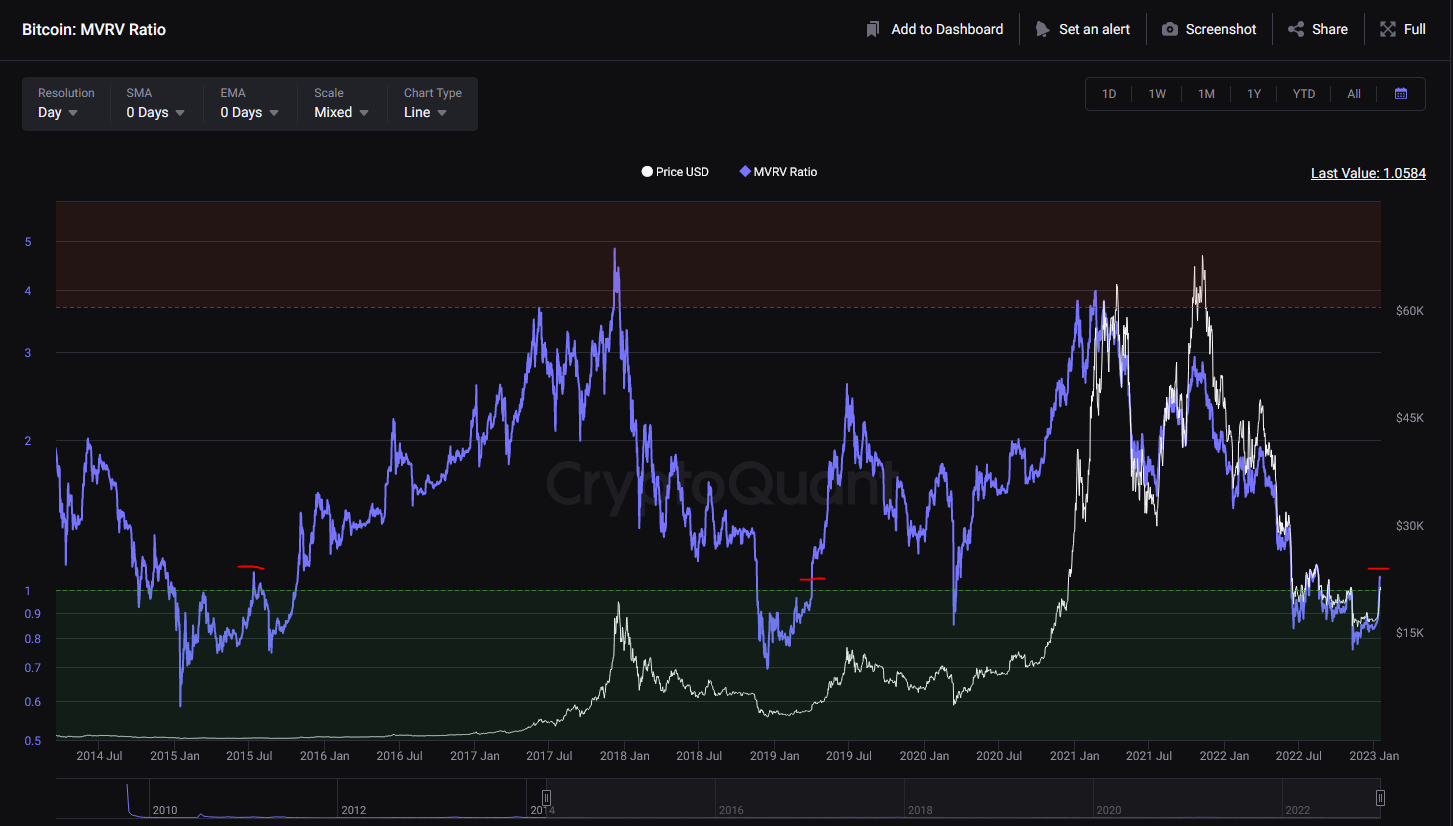
MVRV RATIO and NET UNREALIZED PROFIT/LOSS (NUPL)
Both charts are usually in synch and both flagging the potential end of bear cycle. Again the key question is can you trust we will get an explosive move like in 2019 or a retrace like in July 2015? Don’t think anyone can answer this definitely, but for reasons given earlier, I am leaning towards the 2015 scenario.

PUELL MULTIPLE
Another frequently monitored on-chain metric, while I was expecting to see lower values than we’ve reached, it is clearly gone back to early bullish levels
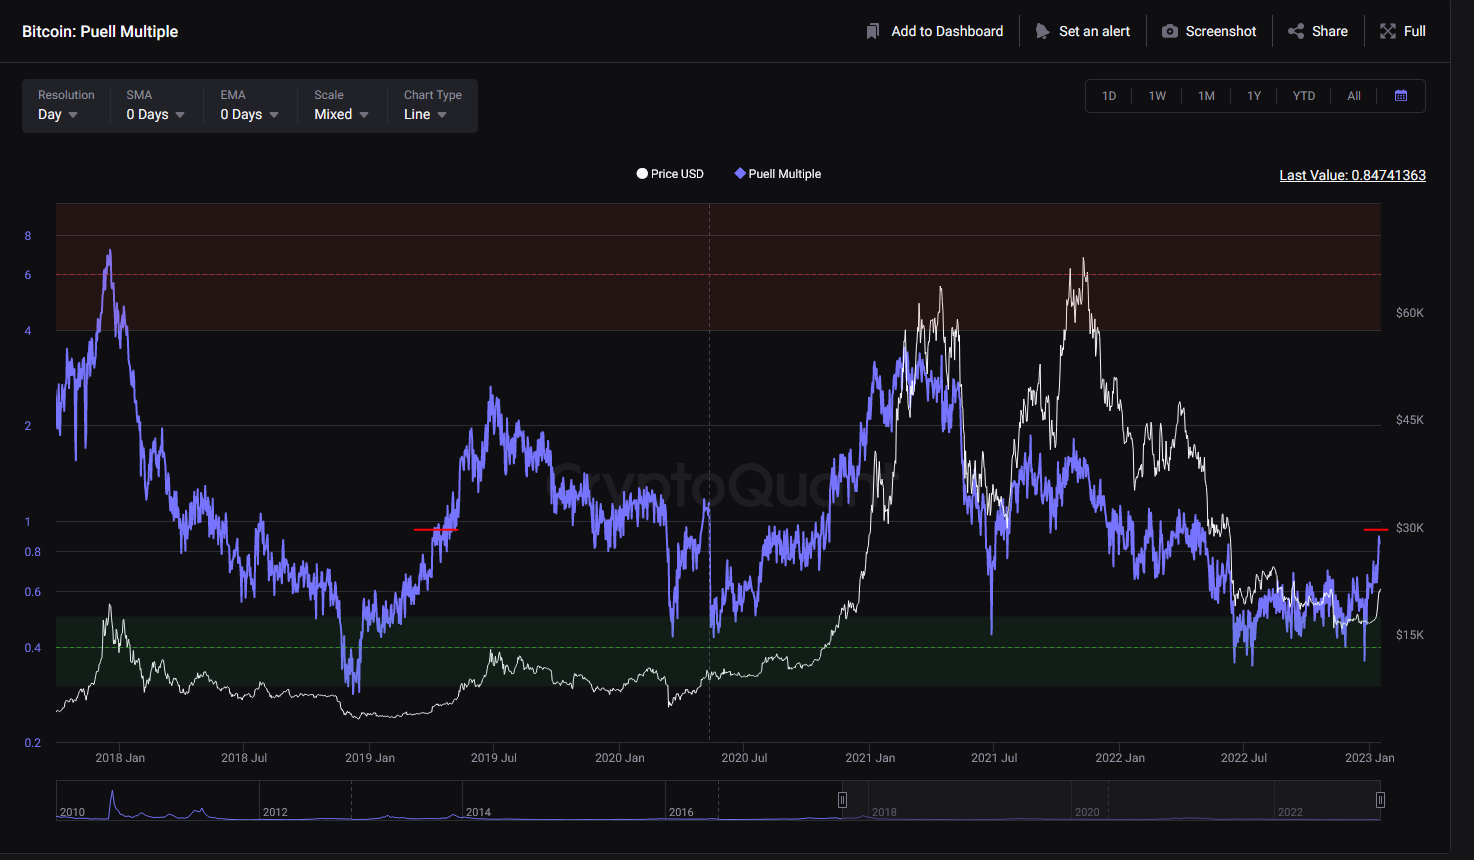
Although again we had a similar situation in 2015, where Puell went to 0.85 in early July before Bitcoin revisited the lows one more time, so I can’t say with full confidence that the only way is UP now.
These are the key on-chain metrics that already flipped bullish and next 2-3 weeks will show if they dip back down to bearish levels. If they don’t, I expect NOT to see 16k anymore bar any macro, geopolitical disaster or another “FTX” like event.
For those that don’t want to worry about short to medium-term, just keep adding to your stack and if you see Bitcoin back under 19.5k I think it won’t hurt to add bit more than usual then. As for altcoins, I think it is still time to hold off, considering any stronger pullback on Bitcoin will crush alts and some might still hit new lows despite recent strong moves.