

Week #29
Week #29
CAN BULLS KEEP BTC UP? ¦ ETH MERGE PUMP, IS IT OVER?

After my last post on a SELL setup, market did in fact moved down, only to check the range lows and pop back up. Either way anyone taking that setup got some profits locked hopefully or at least was able to exit at break even, for those still riding any short setup or just wanting to know if we are ever going to see 20,000$ Bitcoin again, keep reading.
I’ve been posting few on-chain charts in last few days on Twitter, so today just a summary on how I see the info on two assets in question plus couple of charts:
ETHEREUM
Mildly positive price action on Nasdaq and S&P500 adding fuel for the crypto bulls, mainly caused by positive earnings announcements from major players scheduled for this week so far (few including Tesla still to come)
Announcement or should say plans for the ETH 2.0 move to PoS mid September, seem to have started this rally up. It is unusual for ETH to lead the way ahead of Bitcoin, but that is what happened in last few days
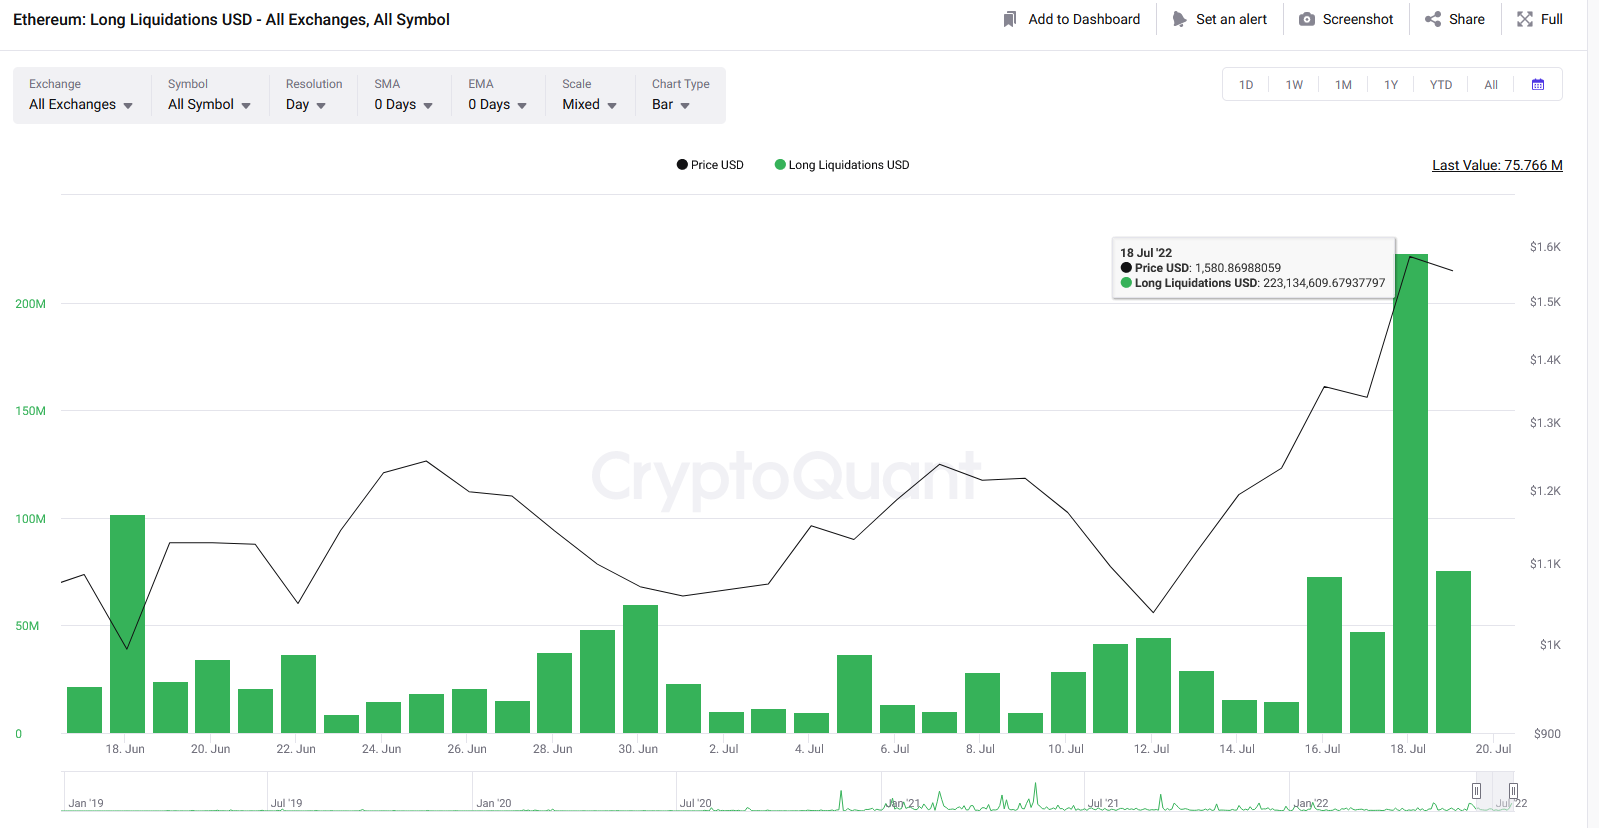
Leverage ratio reached ATH and while a lot of Shorts got liquidated (230M$) over 200M$ worth of Longs got out on 18th, potentially why ETH slowed down today under 1600$
While there is still some room for ETH to move up (most likely target range of 1700-1900) into next week, lower timeframes are screaming for a pullback down. After all we are still in a downtrend and current moves are well within normal as we just reached the “dynamic” zone between 50 and 200DMA
Anyone following ETH transformation to PoS knows well that dates they give for merge been postponed so many times nobody would be surprised if this one got moved too. Crypto Twitter mentions few sources that it is more likely to happen Nov/Dec than in Sept. As soon as they move the date again you could expect a sharper move down
ETC and MATIC attracted some investors, first rumored to take over current ETH miners and latter after Disney apparently choosing Polygon as it’s L2 solution
A lot of the bought Ethereum early on during this rally was immediately staked. You can see this spike on 13th of July, on number of ETH 2.0 deposits charts below

Massive Long liquidations most likely mean, Bulls do not believe this move up is sustainable or that bear market is past its worst already. Will have to see once leverage starts building up again which way the price action goes, that could last a week, so right up the FOMC meeting on 27th of July.
My current verdict on where ETH would go is - I don’t know - most likely still a bit higher before returning closer to 1000$, even if FED only hikes by 75pts they are likely to present a more hawkish stance for the coming months that would hurt all risk on assets.

BITCOIN
TOTAL MCAP for all crypto breached 1T USD first time since dropping below mid June. I see this topping out around 1.1T if at all getting there
Bitcoin’s Dominance dropped very fast as low as 42%, as BTC was quite late to the party. This was well below my expectations of dominance not dropping below 43% and taking the lead again towards 50%. As of writing Dominance returned to 43% and it will be interesting to monitor which way it will go. Normally, during Bull cycle, Dominance dropping below 40% would mean a strong alt season (time where investors shift their focus to riskier than Bitcoin assets in hope of greater gains)
Bitcoin finally broke through 200WMA, closing above it on daily timeframe (still could close weekly candle below) since mid June. We should know closer to end of next week whether this has any meaning and bottom price levels were already in. Regardless, I still strongly believe we will revisit at least 19k in the coming months, as macro outlook has not changed
Leverage ratio and liquidations are following same pattern as mentioned above for Ethereum with longs closing more positions today than shorts. This is not a usual scenario if Bulls have faith in this rally to continue
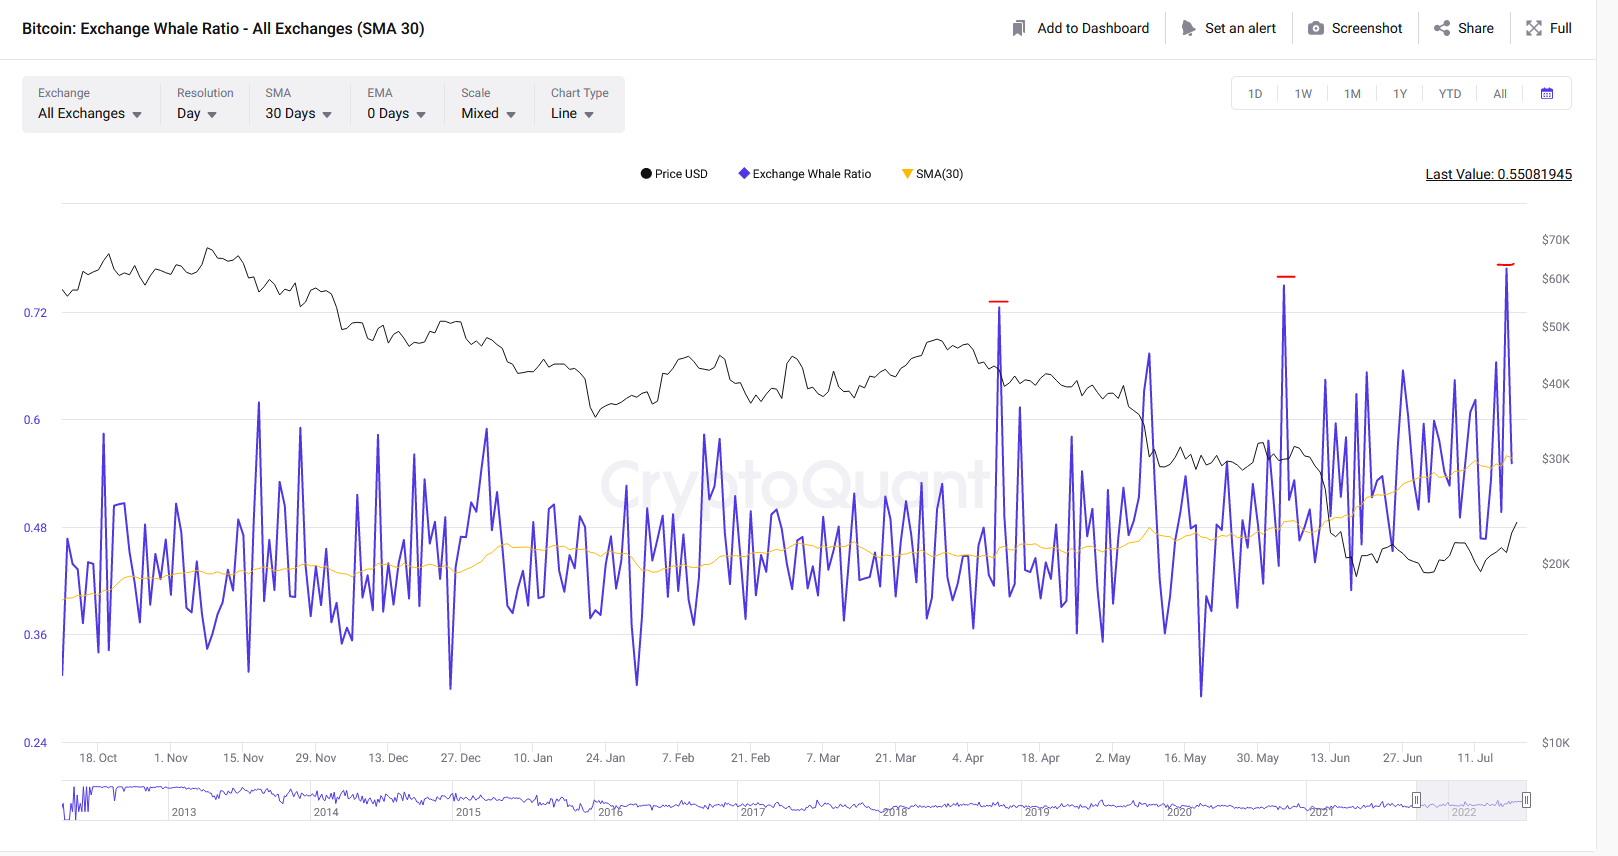
Whale activity on exchanges is increasing, with most recent spike on 17th of July. Looking back at previous spikes and analyzing this for on past Bear markets, it can lead to more selling pressure on BTC very soon (see chart below). It is also worth noting the general increase as visualized by yellow 30 day SMA.
As most of you know I look to a set of on-chain metrics on Bitcoin to judge when we have most likely hit the bottom prices and while TA indicators already triggered the “BUY ZONE” few weeks ago (I’ve suggested that all regular investors start buying weekly in my past newsletters when this flagged up), on-chain metrics did not all align. Here is a quick look at some of those.
NUPL/MVRV
Both return to “bullish” territory, so will just show NUPL below. In 2018 after much longer period spent in “red” once we moved out back into green it meant end of the main phase for bear market was near and last few chances for favorable prices.

This is not a guarantee as back in 2014 bear cycle, NUPL was in and out of the red zone few times before finally settling in above zero. Best to watch this for the next 7-10 days.

Prolonged periods of either positive or negative rates especially if building up in one direction over few days, have been indicating quite well that a move in certain direction is coming to an end (in our case green spike and rising BTC price would add to bearish indicators).

Puell Multiple still within your average bear market final phase zone, giving me some more confirmation that at least a return to previous lows is still on the cards.
Taking all the above into account, a return to lower prices for Bitcoin is the most likely outcome over the next 7-10 days. Not a coincidence that we have an action packed week ahead, ECB possibly rising rates by 50pts this week, FED int rates and more importantly future meetings outlook plus GDP data next week.
Remember when things move too fast in one direction they are more likely to reverse even if temporarily, so control your urges to buy at these prices and wait little bit longer.
If you like the content please subscribe and share. Drop a comment below if you have any questions.