

Week #10
Week #10
HOW TO IMPROVE YOUR MARKET ENTRY WITH SMART DCA

Welcome all to first CryptoG weekly newsletter, where I hope both traders and long term investors will always be able to find something useful to either make their decisions easier or challenge their current strategies.
Here are key takeaways for those in a hurry.
Smart DCA - Learn how to accumulate more, using RSI indicator on daily charts
Trading opportunities - After a short rally ended on 2nd of March, risk on assets returned to the downside, a move that is most likely to continue this week.
Macro outlook - All eyes are on Ukraine and whatever happens there next, will surely impact all markets
Smart DCA
For those that might not know what DCA is or basic principles, I recommend you check Investopedia before reading any further.
This investing strategy is perfect for people that have no time for analyzing the charts, worrying about crypto market volatility and prefer the lack of complexity to its application.
Now while this is all good and most of the time beats any day trading method long term, there are simple ways to let you accumulate more digital asset of your choosing.
In my example I will focus on Bitcoin, as it is and will be at least for another few years the most popular digital asset (some call it digital gold due to it’s finite supply), that investors starting their crypto adventure will look to buy first.
Let me start with showing you the difference in using Smart DCA made over classic monthly intervals.
As you can see investing 1000$ at the end of each month for 4 years, would get us 5.098 BTC, but investing little bit of time in learning some basic technical analysis (TA) would let you accumulate 45% more Bitcoin over the same period of time.
What is needed to use Smart DCA?
access to charts, preferably TradingView, but most exchanges provide the indicator needed
RSI (Relative strength index) indicator attached to a daily Bitcoin chart (in my examples it is set to 11)
preferably an alert set on RSI level of 20
some basic knowledge on how to set limit orders (every exchange usually has resources explaining this or you can check here)
What you are waiting for is for RSI to drop below 20 level which indicates in general that an asset is oversold and potential move up is coming soon. While that setup on daily Bitcoin charts does not occur very often, it still gives better entry prices for the patient investors than blindly DCA into an asset at set intervals. Below you can see examples from 2018-2020.
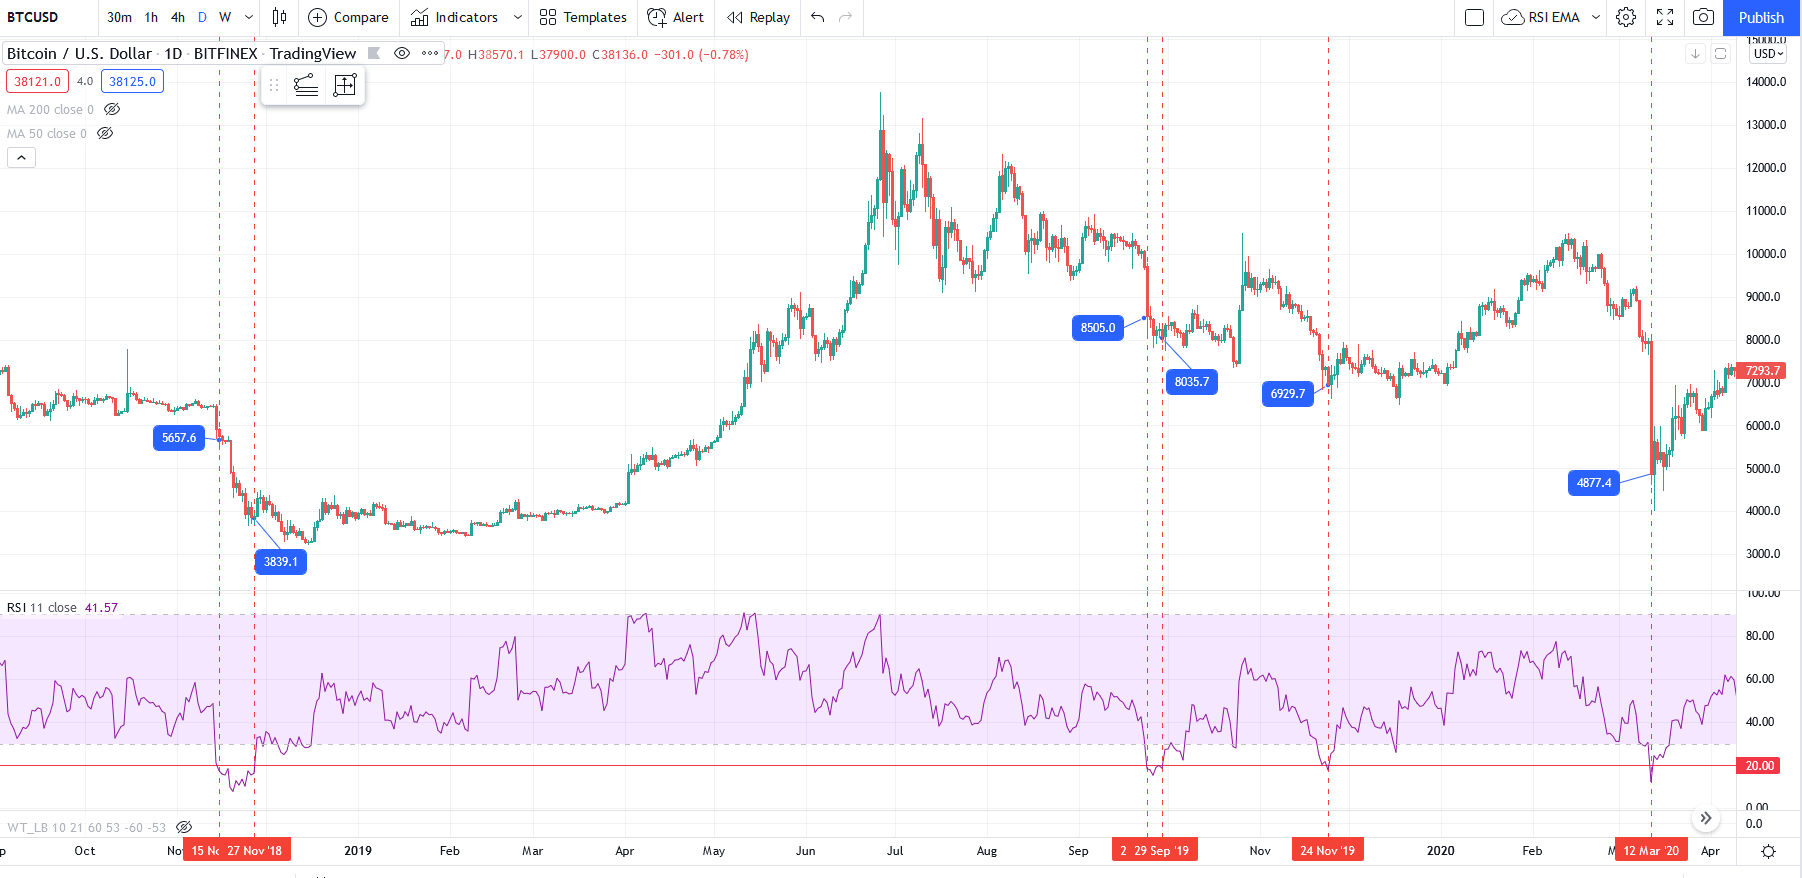
Considering that these setups are rare enough, my entry criteria was to buy BTC with yearly allocation at the Close price of the last candle with RSI below 20 (in case the candle is green you take Open price as your target). That means you will only know a day later when next candle closes on RSI above 20, hence the need to use Buy orders.
Doing it this way you will avoid prolonged moves down during more serious sell offs like mid November 2018.
For those that prefer to buy more frequently you can try to apply same on lower time-frames or working with other RSI levels like 30. Either way do your own research first to know how often you can expect a “Buy” signal to know how much to spend each time.
Before using this method of DCA, think whether this suits your investor mentality. Not everyone feel good sitting on cash for months on end waiting for the right setup or for the almost “mythical”, BOTTOM :P
You are in the right place though, as I will be flagging any potential market entry zones in the coming months that are sure to bring us some great opportunities to buy cheap.
Trading opportunities
As mentioned in the highlights, the general direction for crypto and equity markets is down. Especially when it comes to high risk altcoins as seen below on the TOTAL2 chart (crypto total market cap excluding BTC) the risk of posting lower lows in the coming weeks is highest in a move that clearly follows a downtrend.

There are more TA ideas posted on my Tradingview profile, that confirm further downside is to be expected before we can start buying safely. You can follow me on Twitter @gigisulivan if you don’t want to miss any short term trade opportunities that I might come across midweek.
Weekly overview
Since the start of Russia’s invasion of Ukraine, all market participants are following closely the unfolding events, often with quite a lot of overreaction in the price action. Increase in oil prices, already raging inflation, slow realization that cutting off Russia’s markets and businesses from the West can only push us further into bear market and possibly a global recession. The longer this conflict will last the more damage to economies, some countries already planning for the worse (example from Ireland), considering Russia produces 2/3 of global fertilizers supply and together with Ukraine around 25% of wheat, barley and corn.
Key economic events this week:

Apart from ECB’s interest rates decisions on Thursday, there is little of note and even that is unlikely to rock the market in the light of Ukraine crisis.
Risk off mood will continue to dominate.
That is all I have for you today. If you would like to see more or less of something, drop a comment and look out for more content coming your way outside of the weekly newsletter soon.
Great insights. Nice work Gigi.