
One SECond to ETF
One SECond to ETF
BTC ETFs Approved ¦ Technical and Onchain Analysis

Happy 2024!!
I know it has been a while since my last newsletter, but this one will hopefully answer some of the questions about what is coming next in terms of Bitcoin’s price action based on what I see in charts and onchain. Another newsletter shortly to follow to see how macro might impact crypto market this year (spoiler alert, it’s not looking great).
I know the title is already outdated, as I started writing this a day before the SEC’s X (formerly Twitter) account was taken over for a short enough time to post premature info on BTC spot ETFs approval, which only officially happened today. Many wonder how they can report the SEC to get investigated for market manipulation since normally you would report this to… SEC.
Many see this approval as “holy grail” for crypto, but why would anyone want to pay into an ETF instead of buying the actual Bitcoin?? Of course, I am talking purely about retail, there will be pension funds, etc. that don’t have another option, I just want to make a point for those who even remotely considered putting money into one of the ETFs. Additionally, Gary Gensler clearly states ETFs approval does not mean they are backing Bitcoin or crypto in general. I am fairly sure their battle against crypto is not over and more to come this year around altcoins deemed securities and further regulatory scrutiny over crypto exchanges. This can only bring the prices back down to more reasonable levels than right now and give everyone a chance to buy their favorite coin/token.
What’s in the Charts
As I am writing this part of the newsletter after spot ETF approval, Bitcoin is trading around 46.5 k, so nowhere near astronomical levels some usual crypto “influencer” suspects were trying to make you believe BTC will explode to immediately after SEC gives their thumbs up.
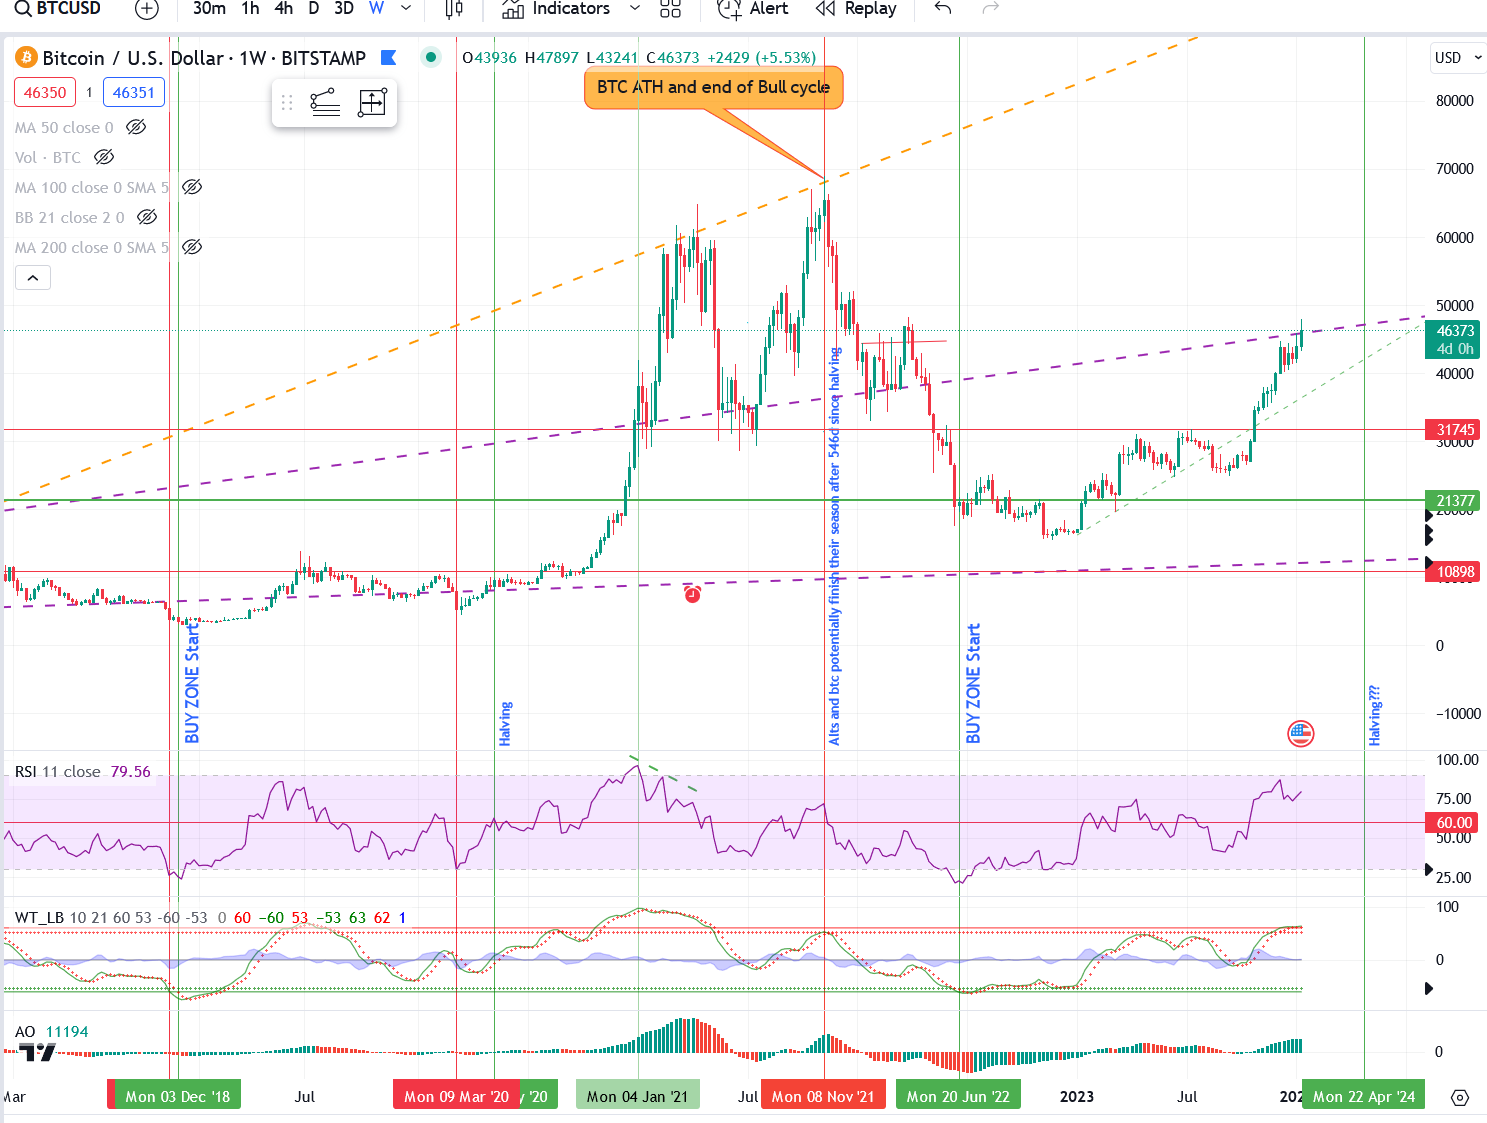
This is a zoomed-in long-term Weekly chart I only update after key events happen like BTC halving, bull run tops, buying indicators align etc., so for those that follow me for a while you know this has not changed since late 2022. The only thing moving a bit forward is Halving timeline currently looks more likely in late April. I am paying attention to when it happens as up until now the 4 year cycles for Bitcoin have very predictable key turning points that happen at same day intervals. I will cover that in detail predictions for rest of 2024 and 2025 after halving occurred.
Now, back to the price action you can see in the oscillators I use that things are quite overheated especially since we are nowhere near the all-time high or in the main phase of the bull run. Similar “overheating” happened mid 2019 and while we are likely not on the verge of another Covid crisis, macro has been brewing one for a while, and in my opinion, it will hit in 2024 before any real crypto bull run can happen.
Even if you do not agree with the above, you should know by now from some practical examples I’ve shown in the past that buying when those oscillators show overbought is never a good idea.
Bitcoin’s price is sitting right now on of my long term trend lines that runs from 2013 bull run top, through 2017 top marking key areas where price bounced in 2021, should serve as resistance and cooling in price back down to most likely level of 32k in the first half of this year. A lot of this depends on macro and purely on TA I do not see a chance for new lows this year, most likely range for BTC if things will take a real turn globally is between 20-25k
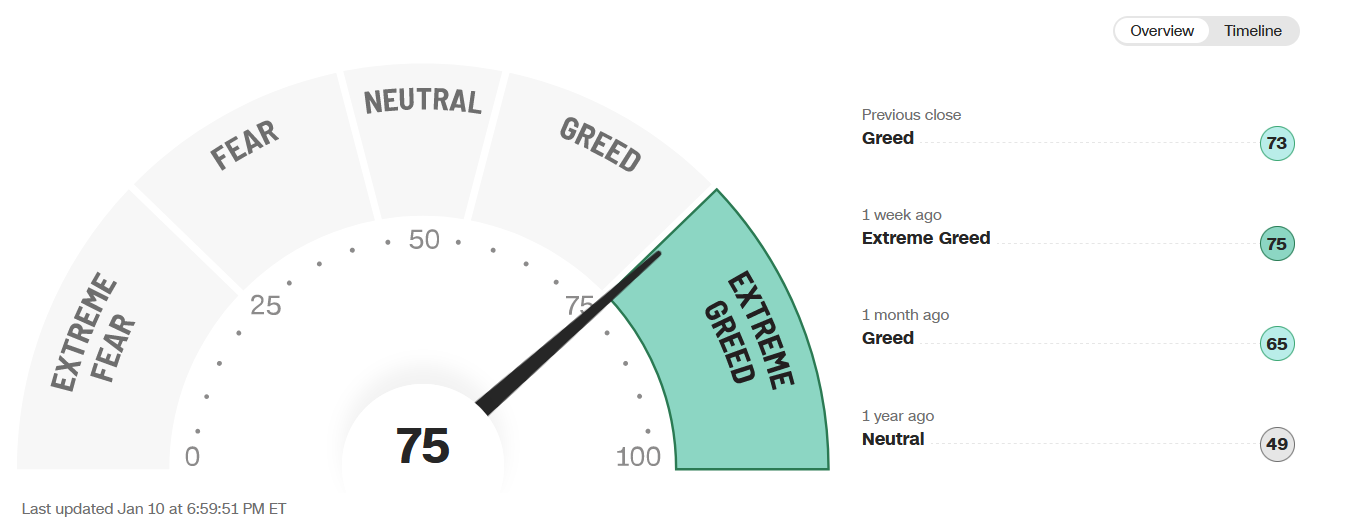
I often mention Fear and Greed indicator as another easy way to time your buys and take profit points. Anything above 50 has been historically not the best time to buy anything and values over 70 unless in the main phase of bull cycle, are an absolute NO for purchases and should be taken into consideration for taking small profits.

Please note that this is also the case for the Stock Market, but I will expand on this in the next newsletter
Just a final note, in case FOMO continues and Bitcoin ticks up for a bit longer I am not expecting it to go beyond 52k. Anyone waiting for a new all-time high, might have to be extra patient or hibernate for a year.
Onchain Analysis
Most of the indicators I follow are quite neutral at the moment and none show that now is the time to buy. Here are a few though that align with TA and suggest taking some profits is a much better idea than giving in to FOMO.
Funding Rates
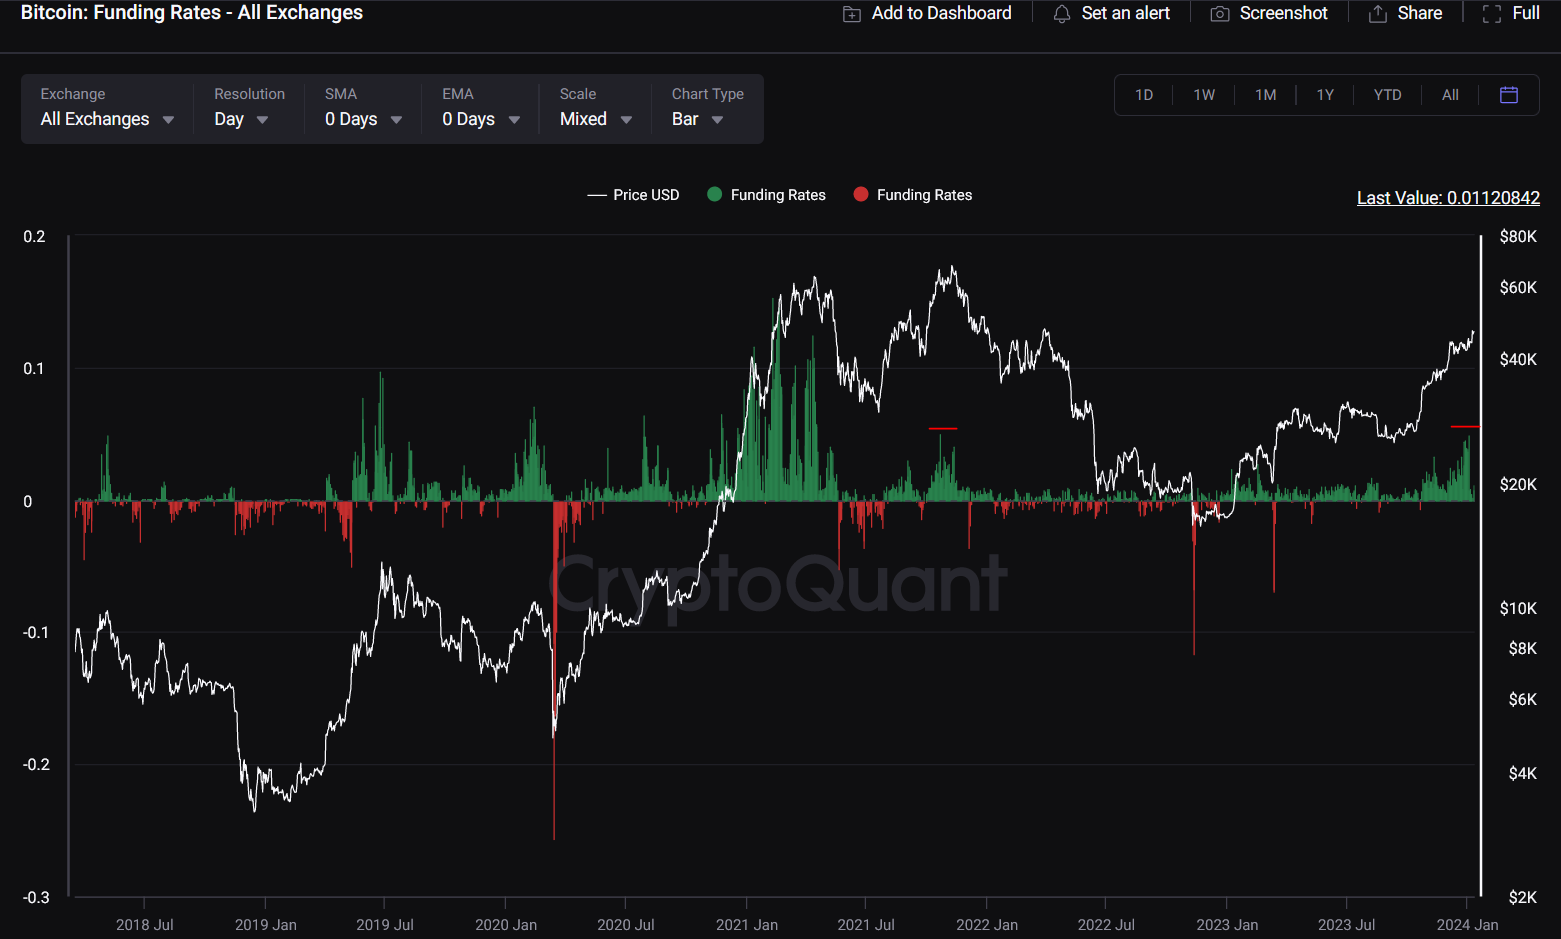
I’ve highlighted current levels and those from Nov 2021 as this is first time funding rates got to such positive levels (meaning bulls are in majority in futures markets). We always see this spike building up before a more serious sell-off (of course during main bull phase this can last much longer, but we are not there yet). This is another confirmation of price likely topping out very soon.
This is also a surefire way to spot best buying opportunities when funding rates fall below -0.1. Unfortunately, that does not happen often.
NUPL - Net Unrealized Profit/Loss

While this one is not outright bearish, I wanted to show how long we have been in a profit territory already and very likely returning under the 0.3 level at some point sooner or later this year before the actual pump starts.
Supply in Profit %
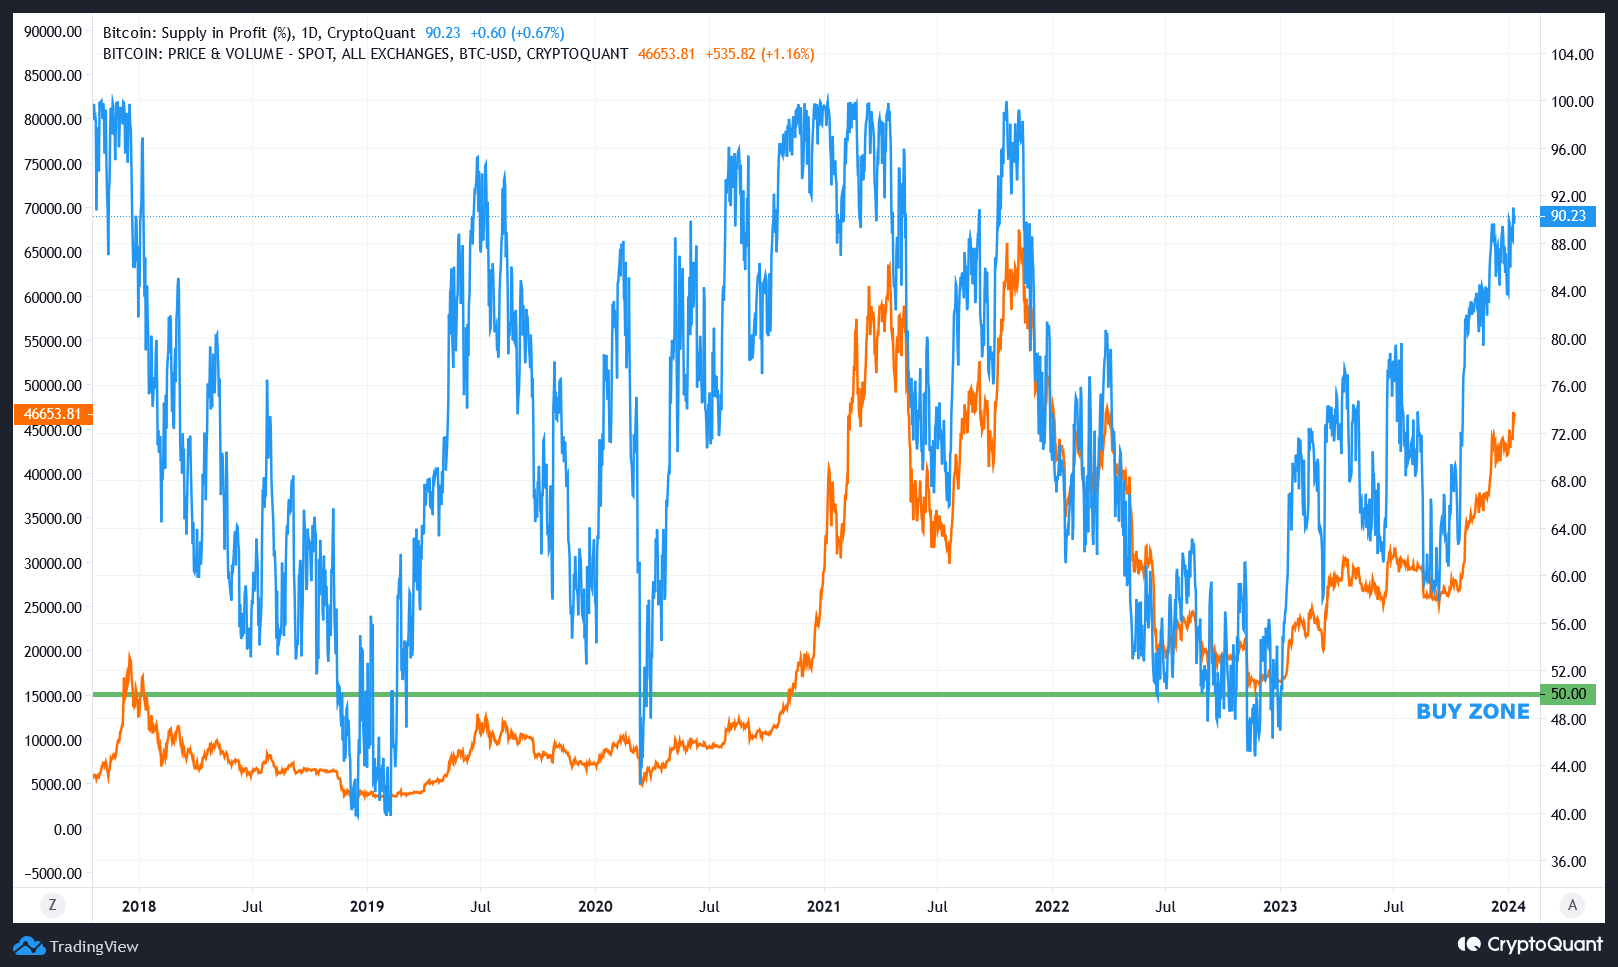
This shows most clearly how much FOMO we have in the crypto market as over 90% of supply is now in profit and that never lasts long especially outside of a bull run.
I have mentioned this before, but add it to your notes, if you ever see this onchain metric below 50% it is time to BUY.
I will have part two of this early 2024 outlook taking into account macro factors in the next few days, please share and subscribe if you have not already and feel free to comment or ask questions. Thank you all for your support last year and remember not your keys not your crypto!!
